
Bitcoin’s price has cleared a key hurdle that has historically preceded major bull runs
Bitcoin closed above its 50-week moving average for the first time in 45 weeks, extending a recent recovery. Galaxy Research notes that historical crossovers of this metric have often preceded broader market uptrends, though past performance does not guarantee future results.
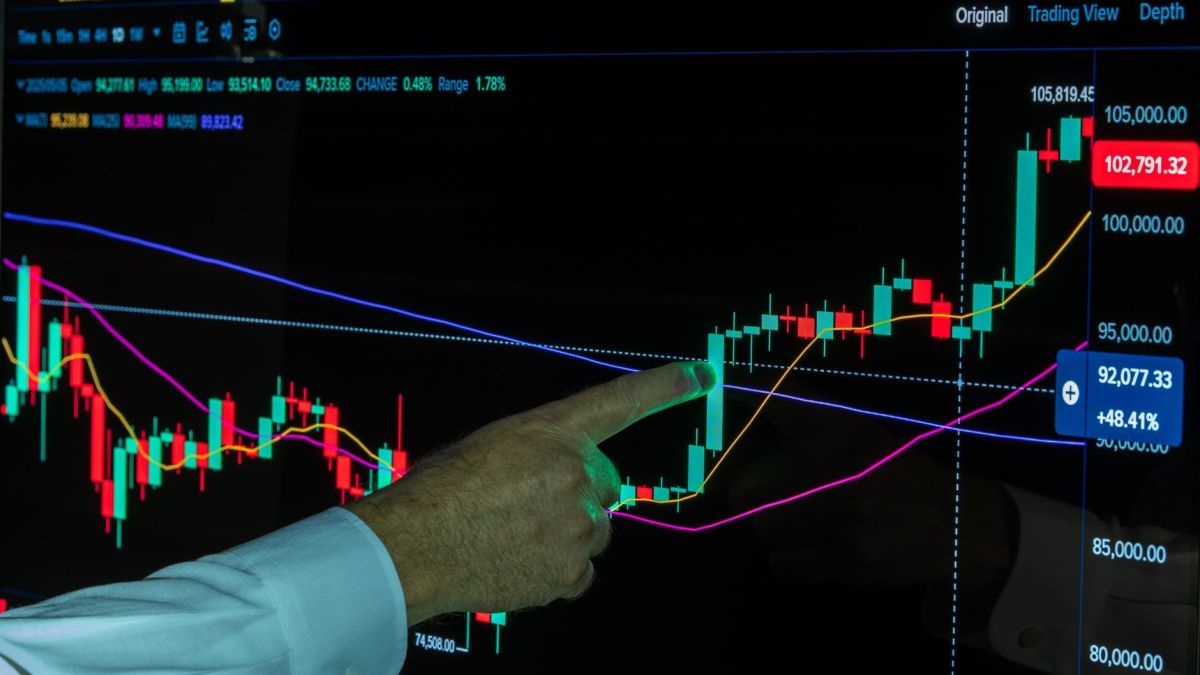
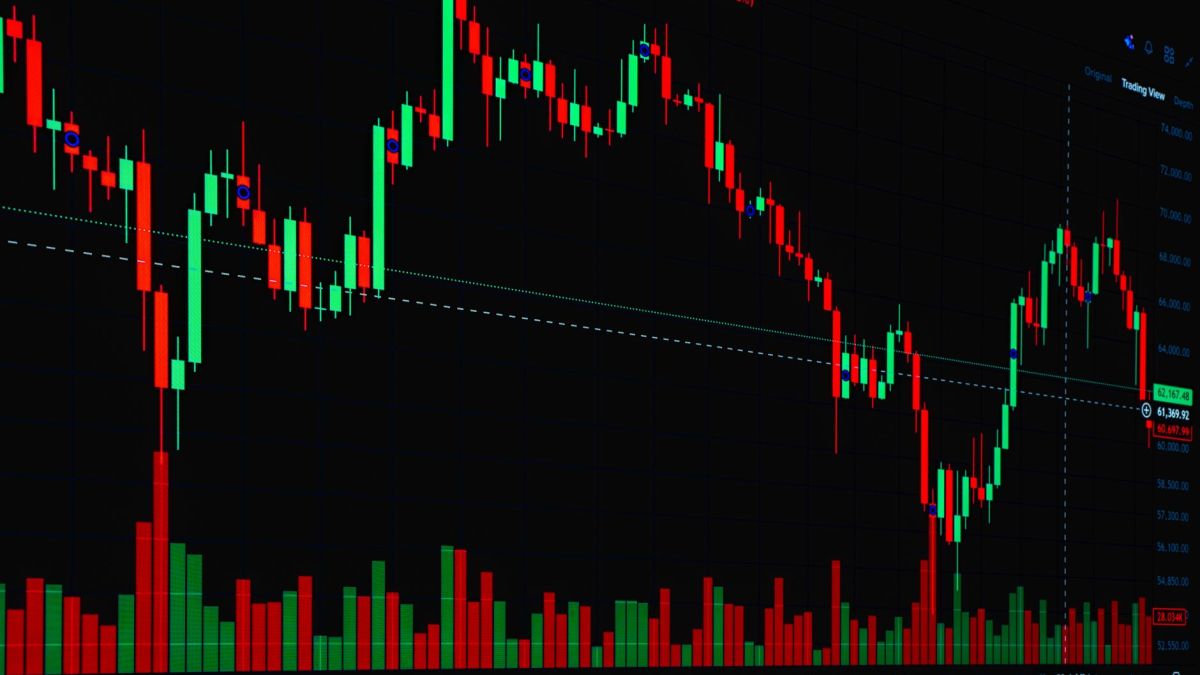
Bitcoin has officially surpassed a critical technical barrier that market participants closely monitor to gauge long-term asset trends, recording a weekly close above its 50-week moving average for the first time in 45 weeks according to market data and reports from CoinDesk. The cryptocurrency climbed roughly 6% over the week to trade around $81,000, compounding a 29% recovery over a span of 35 days and signaling potential stabilization in broader digital asset markets.
Quick summary
- Bitcoin closed a week above its 50-week moving average for the first time in 45 weeks.
- The digital asset rose nearly 6% during the week, trading around the $81,000 threshold.
- This upward movement extends the cryptocurrency's recovery to 29% over the past 35 days.
- Galaxy Research notes that historical crossovers of this metric have often preceded broader market uptrends.
- Past performance does not guarantee future results, as false breakouts occurred during late 2021 and early 2022.
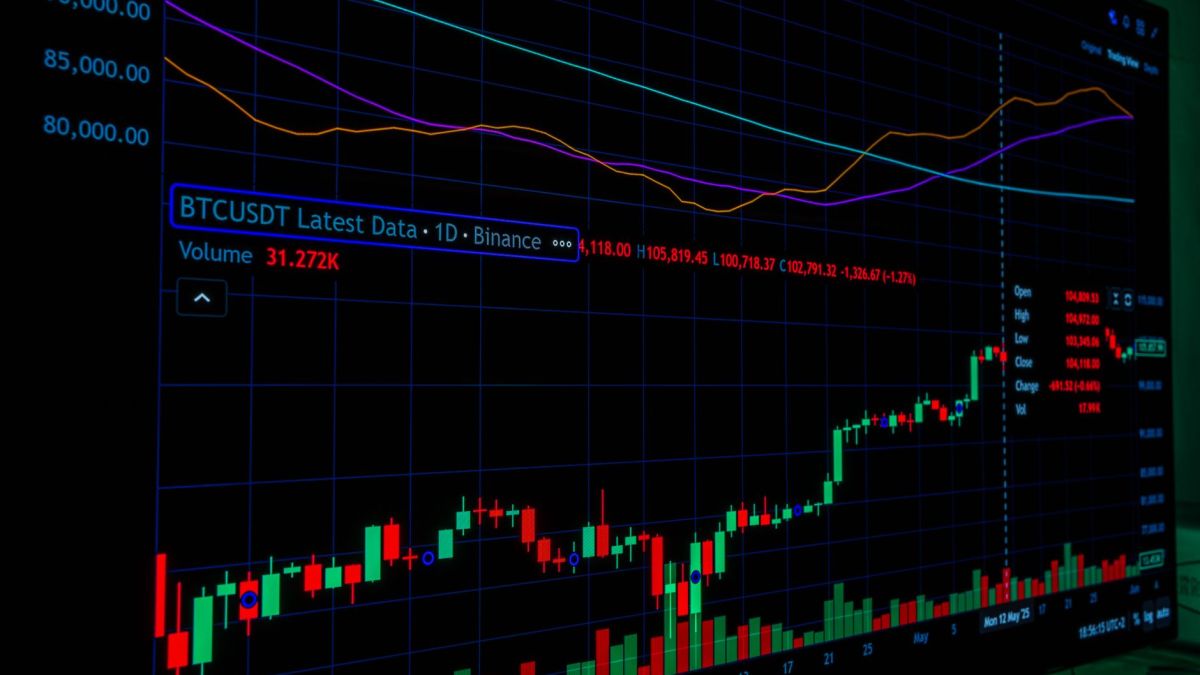
What happened
The final barrier standing between bitcoin and a potentially broader market recovery has fallen after the cryptocurrency closed the week ended September 20 above its 50-week moving average. This technical development marked what Alex Thorn, Head of Galaxy Research, described as an important confirmation that the market's previous bear phase may have run its course. Rather than merely testing the threshold during intraday volatility, the cryptocurrency pushed its weekly candlestick decisively above the average line.
Trading operations for digital assets run around the clock, but market analysts typically place greater emphasis on weekly and daily candle closes, which finalize at 23:59 UTC on Sundays. At the time of reporting, bitcoin was trading near $81,450, while the 50-week moving average sat at $78,115 according to CoinDesk data. The recent price action follows a steady accumulation of gains that lifted the asset significantly away from recent lows.
The cryptocurrency's advance reflects a steady climb over a period of 35 days, bringing cumulative gains to 29%. Observers note that weekly candlesticks provide a clearer graphical representation of price action over a seven-day period compared to continuous intraday fluctuations. Market participants use these standardized weekly metrics to filter out short-term market noise and identify sustainable shifts in momentum.
How we got here
To understand the significance of the 50-week moving average, market observers look at its historical behavior as a long-term trend proxy representing the average weekly closing price over approximately the past year. During healthy market advances, bitcoin typically trades comfortably above this line, whereas prolonged declines see rallies continually fail underneath it. Galaxy Research notes that the average has historically acted as a ceiling during major drawdowns, where recovery attempts fail until the market nears a durable low.
- Late 2021 and early 2022: Bitcoin experienced false breakouts above the 50-week average before rolling over toward $16,000.
- Recent months: Bitcoin established a bear-market low near the $60,000 region.
- Past 35 days: The asset mounted a 29% rebound, culminating in the recent weekly close above the 50-week average.
The progression of the digital asset market has involved several distinct cycles of contraction and expansion since 2011. Analysts at Galaxy Research reviewed major historical slumps to evaluate how moving average crossovers functioned across different economic environments. These historical evaluations indicate that successful reclaims of the 50-week metric generally correlate with the conclusion of prolonged bearish phases.
Who are the involved parties
Market analysis firm Galaxy Research and its Head, Alex Thorn, played a central role in evaluating the historical implications of the recent price movement. By examining previous market slumps dating back to 2011, Galaxy provided essential perspective on how similar technical crossovers behaved across different economic cycles. Data source CoinDesk also contributed vital market telemetry tracking the live pricing of bitcoin and its moving averages.
In addition to research institutions, global market participants and retail investors actively monitor these technical thresholds to inform their market strategies. While institutional analysts provide structured interpretations of moving averages, the broader market movement is driven by aggregate global buying and selling pressure across continuous trading environments.
What the sources say
Galaxy Research reported that after analyzing major Bitcoin slumps since 2011, the asset has closed a week back above its 50-week moving average 13 distinct times. In 11 of those 13 instances, the market did not proceed to establish a new low, suggesting that the worst of the downward pressure had already passed. However, researchers noted that past performance does not guarantee future results, pointing out two notable failures during the volatile market environment of late 2021 and early 2022.
According to the findings, those two failed reclaims occurred on December 26, 2021, and March 27, 2022, when bitcoin briefly moved above the average before declining toward $16,000. Analysts emphasize that the current breakout's validity remains contingent on whether the cryptocurrency can maintain its position above the moving average line in the upcoming weeks.
Explainer
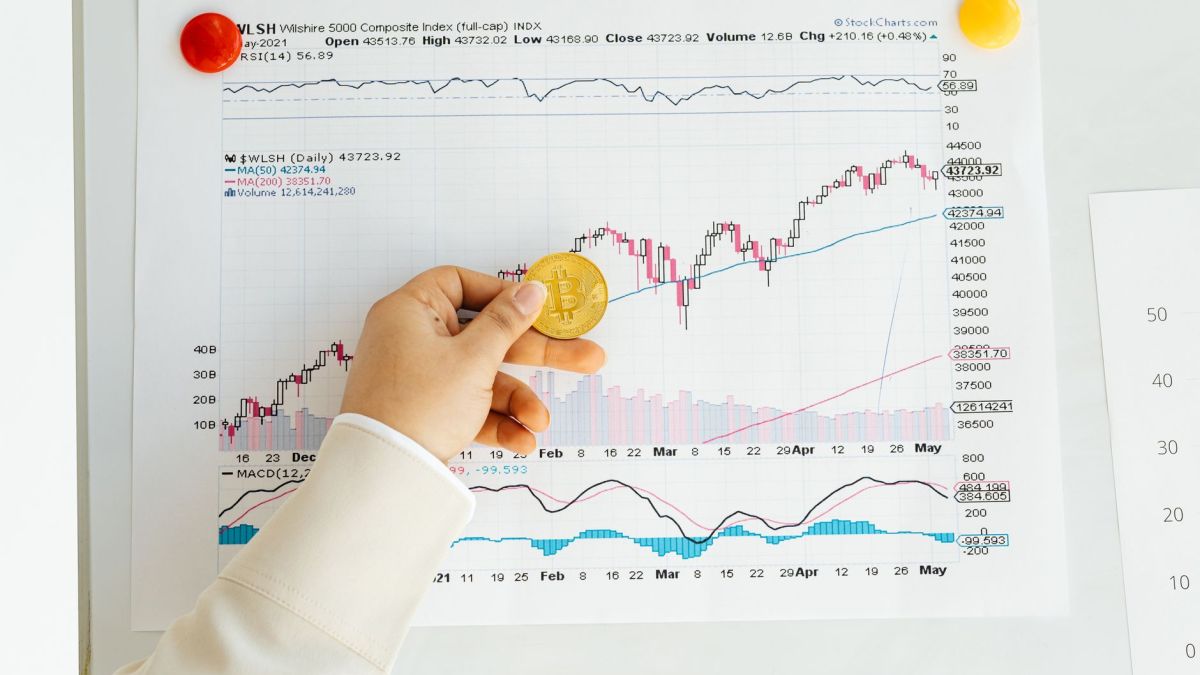
The 50-week moving average is a standard financial metric calculated by taking the average closing price of an asset over the past 50 weeks, serving as an indicator of long-term market direction. A stablecoin is a type of cryptocurrency designed to maintain a stable value, typically pegged to a fiat currency like the U.S. dollar, bridging traditional finance and digital assets. It is important to emphasize that this overview is strictly informational and does not constitute financial advice, asset recommendations, or promises of future profitability.
Cryptocurrencies are subject to substantial market volatility and digital asset investments carry a high risk of capital loss. Readers should conduct independent research and consult qualified financial professionals before making any investment decisions. This content is provided for educational purposes only and does not endorse any specific financial action.
Impacts and what it matters
A successful breakout past the 50-week moving average has historically marked the conclusion of bear markets and paved the way for pronounced upward trends, according to historical market examinations. If historical patterns serve as a reliable guide, the recent reclaim suggests that the bear-market low may have been securely established near the $60,000 mark in recent months. This technical confirmation raises the possibility of continued advancement toward new highs, though market participants remain cautious given historical precedent.
The ongoing stability of the asset above this long-term trend indicator serves as a crucial reference point for institutional and retail strategies alike. While historical metrics offer valuable context, macroeconomic factors and shifting regulatory frameworks across global jurisdictions also influence broader asset valuations. Observers continue to track how digital currencies interact with traditional financial systems as adoption evolves.
What comes next
The immediate trajectory of the cryptocurrency depends heavily on whether bitcoin can successfully hold above the 50-week moving average in the coming weeks. Market analysts will continue monitoring weekly candle closes and broader macroeconomic conditions to determine if the current rebound transforms into a sustained upward trend. This content is purely educational and does not constitute any form of investment recommendation.
Disclaimer: Cryptocurrency investments involve substantial risk of loss and are subject to high market volatility. Readers should conduct their own research or consult qualified financial professionals before making investment decisions.
Quick questions
What technical milestone did Bitcoin recently reach?
Bitcoin closed a week above its 50-week moving average for the first time in 45 weeks. This movement extended the asset's recovery to 29% over a 35-day period.
What does the 50-week moving average represent?
It represents the average weekly closing price of an asset over approximately the past year, serving as a proxy for long-term market trends. Healthy market advances typically see trading occur above this line.
What do historical crossovers indicate according to Galaxy Research?
Galaxy Research found that in 11 out of 13 historical instances where Bitcoin closed back above this average, the market did not set a new low. However, researchers emphasize that past performance does not guarantee future results.
Sources consulted
Written with the help of artificial intelligence from the sources above. Found a mistake? Let our editors know.
Read next
Bitcoin Tops $81,000 as NEAR Jumps 23% on Zcash Swap Traffic
Bitcoin held just above $81,000 while the NEAR token climbed 23% to over $4 amid a significant rise in cross-chain Zcash swap activity. The movements follow regulatory developments regarding tokenized stocks and broader Asian equity gains.

Croatia vs Spain: Nations League preview, lineups and stakes
Croatia host Spain at Stadion Poljud in Split on Tuesday, October 6, in the UEFA Nations League 2026-27 Group A3. Spain arrive with a perfect record and a 41-match unbeaten run, while Croatia look to respond after their heaviest defeat in history.

MRVL stock: Marvell shows 2nm optical links, expands AT&S deal
Marvell Technology (MRVL) presented what it calls the industry's first 2nm optical interconnect demonstrations at ECOC 2026 and expanded its collaboration with AT&S to secure advanced IC substrate capacity for future AI and cloud infrastructure products.